Cloudflare's Ashburn Outage: Four Hours of 5xx Errors, and It Still Wasn't 'Down'

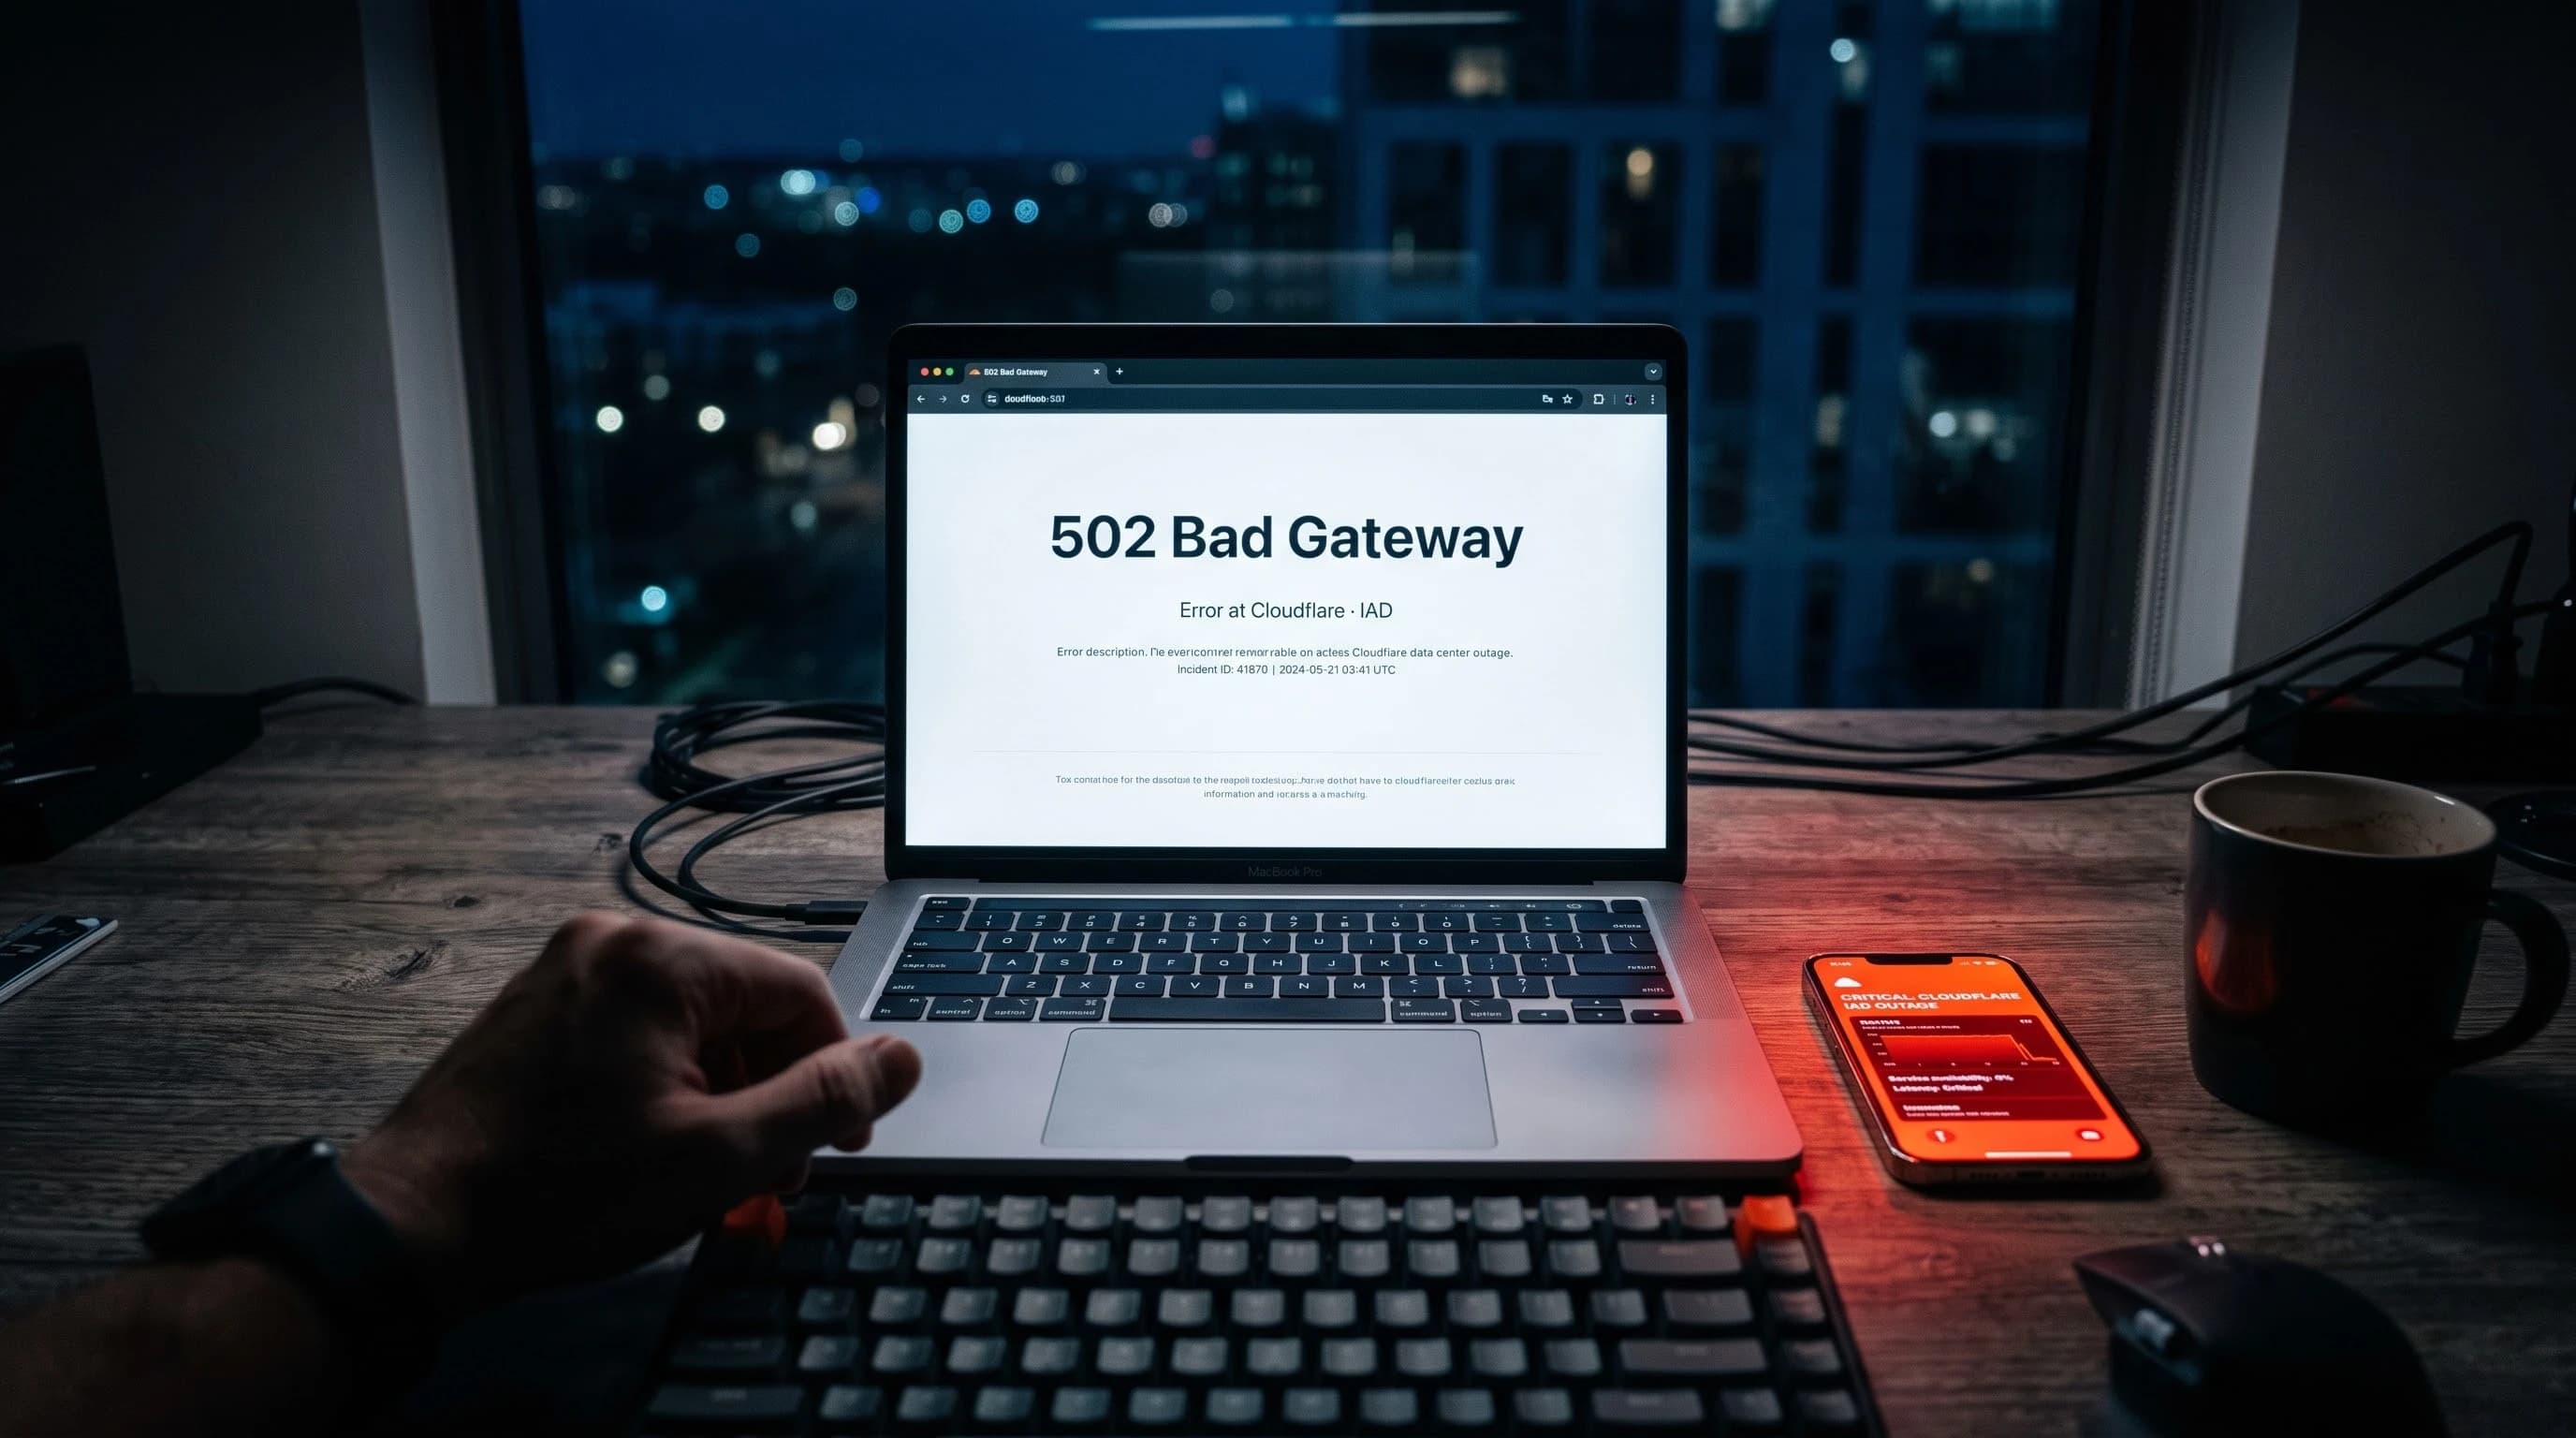
At 18:45 UTC on July 31, 2026, Cloudflare's Ashburn data center, known internally as IAD, started throwing an elevated rate of HTTP 5xx errors. It didn't stop until 23:01 UTC. That's four hours and sixteen minutes where a chunk of the internet's East Coast traffic was quietly failing, and Cloudflare's own status page filed it as a routine resolved incident with a single paragraph.
Ashburn isn't a random data center. It sits in what the industry calls Data Center Alley, the stretch of Northern Virginia that reportedly carries a huge share of the world's internet traffic. When IAD has a bad afternoon, it's not a regional blip. It's one of the load-bearing walls of the internet having a bad afternoon.
What Actually Happened
Cloudflare's status history logs it plainly: an increased level of 5XX errors in Ashburn, US, from 18:45 UTC to 23:01 UTC on July 31. No BGP withdrawal, no bad config push publicly detailed, no dramatic root cause post-mortem the way Cloudflare published after its February BYOIP incident or its November 2025 Bot Management file crash. Just a status line and a resolved timestamp.
That same day, Cloudflare logged a second, separate 5xx incident earlier in the morning, from 02:01 to 04:19 UTC, specifically affecting customers routing to AWS's us-east-1 region through Cloudflare. Two distinct error spikes, same 24 hour window, same company's infrastructure.
Neither incident made international headlines. Neither trended on X. If you weren't specifically watching Cloudflare's status page or your own uptime alerts that evening, you had no reason to know either one happened.
Why "Minor" Doesn't Mean "Nobody Noticed"
Cloudflare didn't classify the Ashburn incident as a major outage. From their side, that's a fair read: it wasn't a total edge network failure like the November 2025 incident that took down X and ChatGPT, and it wasn't a six hour BGP mess like February's BYOIP issue. It was an elevated error rate at one location for a few hours.
But elevated 5xx errors at one of Cloudflare's largest data centers for four straight hours means every site whose traffic happened to route through Ashburn during that window was intermittently failing requests. Some percentage of visitors to those sites got a server error instead of a page load. For a freelancer's client running a checkout flow or a booking form, an intermittent 502 for four hours isn't minor. It's four hours of some fraction of paying customers hitting a wall.
This is the gap between how infrastructure providers grade their own incidents and how the businesses sitting on top of that infrastructure experience them. Cloudflare's severity label is calibrated to Cloudflare's global network. Your client's severity label is calibrated to whether their site worked when someone tried to buy something.
The Pattern Worth Noticing
This is now at least the fourth Cloudflare incident of 2026 with a public status page trail: February's BYOIP outage, whatever triggered the November 2025 config crash carrying into this year's retrospectives, and now two separate error spikes in a single day at the end of July. None of them are proof Cloudflare is unusually fragile, every major provider racks up incidents like this. What they are proof of is that "my site is on solid infrastructure" and "my site never goes down" are two different claims, and only one of them is true.
You cannot audit Cloudflare's internal routing decisions. You cannot get a warning before an elevated error rate starts in a data center three states away from your client. What you can do is make sure something is actually watching when it happens, because Cloudflare's own status page updates on its own schedule, not yours, and "resolved" doesn't mean nobody's checkout page was broken in the meantime.
What This Means for How You Monitor
An incident like this is exactly the kind that a slow polling interval misses entirely. If your monitoring tool checks every 5 or 10 minutes, a chunk of a four hour, intermittent error window can slip through checks that happen to land during a working request. This is the argument for checking closer to every 30 to 60 seconds, not because your client's site is fragile, but because the infrastructure underneath it has bad afternoons you don't get advance notice of.
It's also the argument for an alert that actually reaches you instead of one that waits politely in an inbox. Four hours is enough time to notice, investigate, and reach out to a client before they notice for you, but only if you find out in the first thirty seconds instead of the next morning.
Cloudflare's status page grades its own incidents. Your monitoring should grade what your client actually experienced. SIOPS checks in under 60 seconds and sounds a Critical Device Alarm that gets through Do Not Disturb, starting free at siops.app.